
It’s easy to worry, in today’s world, that crime is getting worse. After all, news stations typically report on crime more than they do on anything going well, and there’s so much access to news today that you can easily make yourself believe that the world is much more dangerous than you may otherwise think. However, do the numbers really back that up? Is the world actually as dangerous as it may seem? Here’s what you need to know about the truth regarding changing United States crime rates.
America’s Changing Crime Rates Created By: PeopleFinders
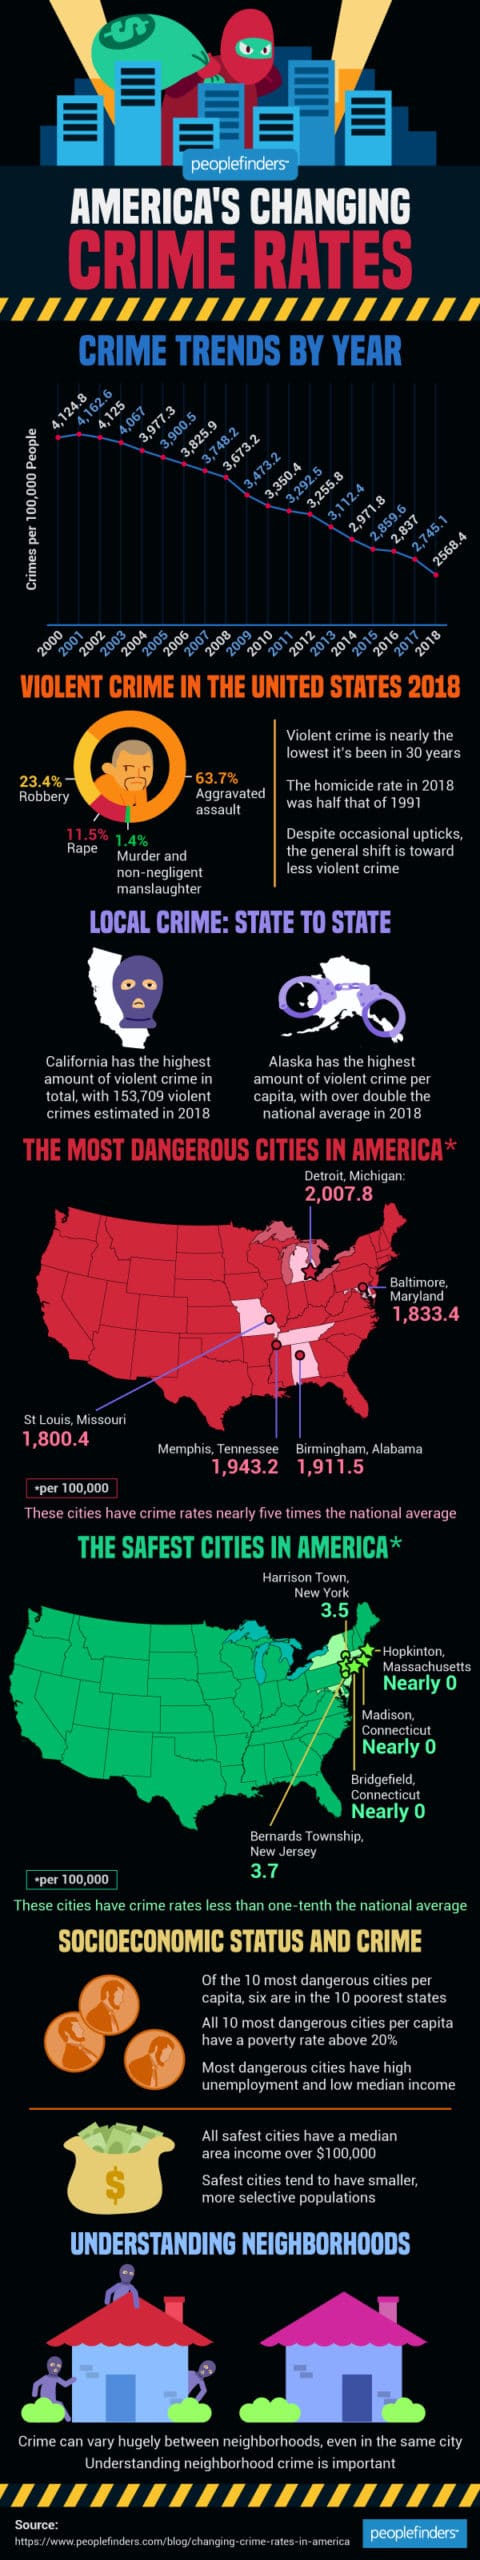
Overall Crime Rate
The overall crime rate is one good way to understand the general trend of crime. This includes all crime, including violent crime and property crime. According to the FBI, this is the crime rate per 100,000 every year since 2010:
- 2010: 3,350.4
- 2011: 3,292.5
- 2012: 3,255.8
- 2013: 3,112.4
- 2014: 2,971.8
- 2015: 2,859.6
- 2016: 2,837
- 2017: 2,745.1
- 2018: 2,568.4
As you can see, every single year, the crime rate has gone down. Overall, crime is decreasing, not increasing. Although it may feel as though the country is getting more dangerous, the numbers just don’t back that up.
Violent Crime Rate
Because the overall crime rate also includes nonviolent crime, it’s easy to worry that it doesn’t reflect reality. Perhaps property crime is going down dramatically, but violent crime is going up. Here’s the violent crime rate per 100,000 since 2010:
- 2010: 404.5
- 2011: 387.1
- 2012: 387.8
- 2013: 379.1
- 2014: 375.7
- 2015: 372.6
- 2016: 386.3
- 2017: 382.9
- 2018: 368.9
There are some upticks, with 2012 and 2016 both seeing slight rises in violent crime, but overall, the violent crime rate is also going down. In 2018, violent crime was down nearly 9% from 2010. Plus, the homicide rate in 2018 was fully half of the homicide rate in 1991.
Crime by State
Statewide crime statistics can also hold some interest. California, for example, has the highest amount of violent crime overall – an estimated 153,709 in 2018. However, while this number may seem astronomically high, it’s important to remember that California also has nearly 40 million people in it, making the crime rate in California about average. Alaska has the highest per capita; its crime rate was over double the national average in 2018.
Most Dangerous Cities to Live
What about on a city level? Cities can have significantly different crime rates than the country as a whole, and the most dangerous cities in the United States are proof of that. These are possibly the most dangerous cities, with violent crime rates that are nearly five times the nationwide average:
- Detroit, Michigan: 2,007.8
- Memphis, Tennessee: 1,943.2
- Birmingham, Alabama: 1,911.5
- Baltimore, Maryland: 1,833.4
- St Louis, Missouri: 1,800.4
Safest Cities to Live
On the other hand, there are some cities that are significantly safer than other areas in the United States. The safest cities in the United States are safe enough that you have a nearly imperceptible chance of falling victim to violent crime. These are possibly the safest cities in the United States, with crime rates per 100,000 that are less than a tenth of the national average:
- Hopkinton, Massachusetts: Nearly 0
- Bridgefield, Connecticut: Nearly 0
- Madison, Connecticut: Nearly 0
- Harrison Town, New York: 3.5
- Bernards Township, New Jersey: 3.7
Socioeconomic Status
It’s hard to overstate the impact of socioeconomic status on safety. All 10 of the most dangerous cities in the United States have a poverty rate above 20%, which is nearly twice the national average. The safest cities, on the other hand, have a median area income above $100,000, again almost twice the national median. Socioeconomic status may be one of the most impactful things to consider when it comes to safety in a certain area.
Conclusion
As you can see, changing crime rates in America have to do with a number of different factors. Additionally, crime rates have actually gone down overall, not up. Even if you feel less safe, it might not be reflective of the actual experiences that are happening around you. If you want to be safe, you need to know information. That’s why many people have chosen to use public record search engines to gather real information about the area around them to stay safe in their neighborhoods.


Recent Comments